This article is the first part of a three-part series, which considers the effect of global warming on ocean level rise, and examines life with constantly advancing seas from two perspectives: that of the landlubber and that of the seafarer. Part I: The Global Mistake  photo courtesy CoastalCare.org
(that’s a balmy 7.2°F) by 2055 given a business as usual scenario. Some places will be a bit more stable, but the places that particularly matter – the ice caps, the methane-rich permafrosts in northern Canada and Siberia, and the Amazon rainforest -- will be melting, off-gassing, and burning, respectively. The report offers some detail on what that would feel like:
And what of that lodestone, global sea level? This happens to be a very interesting question, because ocean levels are set to rise dramatically. According to UCLA scientists, the last time carbon dioxide levels were as high as they are today was 15 million years ago. At that time, the sea level was between 20 and 36 metres higher (75 to 120 feet), there was no permanent ice cap in the arctic, and very little ice in Antarctica or Greenland. That is where we are headed. The only remaining question is, How long will it take us to get there? The authors of the Hadley Centre report predict a rise of just 1.4 metres by 2100. The IPCC in their 2007 4th Assessment Report predicted something like half a metre by 2100 based on a combination of the fattening of the oceanic envelope caused by thermal expansion and the increased runoff from glaciers and minor ice sheets. None of this sounds particularly catastrophic just yet, but then it turns out that these predictions are not based on anything particularly relevant: the British Antarctic Survey, in 2008, made it clear that the IPCC had not included the source of nearly 100% of the world’s potential ice melt – the major ice caps of Antarctica and Greenland – simply because they had little idea of how the ice caps would behave in a heating world:
Thus, the most peer-reviewed piece of climate science ever written turns out to be completely inadequate when it comes to estimating the level of disruption associated with a very important aspect of climate change: the rising seas. If Antarctica contains 90% of the world’s land ice (sea ice, like that in the Arctic, does not directly cause the oceans to rise when it melts) and Greenland contains most of the rest, then what’s going to happen when they start to melt with a vengeance, and when are they going to start melting? Official science is mute on the subject. What Do We Know? There are some things that we do know. Based on the volume of ice lying upon the landmass of Greenland, it is quite possible to estimate how far the oceans would rise, should all of it melt away: something in the region of 7.2 metres. That may not seem like a lot, but, as you will see in Part 2 of this series, it will be enough to have devastating consequences for the lower lying parts of the world, which, not coincidentally, are the locations of some of the world’s largest cities. (In fact, there is something you can do to make reading this article more exciting: find out how high above sea level you live, and, as you read along, keep checking to see if your head is still above water.) Rapid, dramatic change beggars the imagination. The Greenland Ice Sheet is massive, having formed during the first cycle of the most recent major glacial period, and our instinct tells us that it should remain stable in all but the most extreme conditions. It is disconcerting to know that the onset of an ice age can take as little as two decades, implying that an equally sudden melt cannot be ruled out. It is also disconcerting to know that the conditions required for a sudden melt are pretty much guaranteed to occur, and that, in fact, the ice sheet is already melting. We don't have to imagine it. All we have to do is observe:
This analysis, by the team controlling the GRACE satellite system, is essentially saying that conditions like those in 2007 are able to counteract the damping effect of even the thickest parts of Greenland’s ice sheet. So, when will all the ice melt? There are two schools of thought, but they basically come down to when the temperature of Greenland increases by either 4°C or 8°C above the mean global average of the last 100 years. 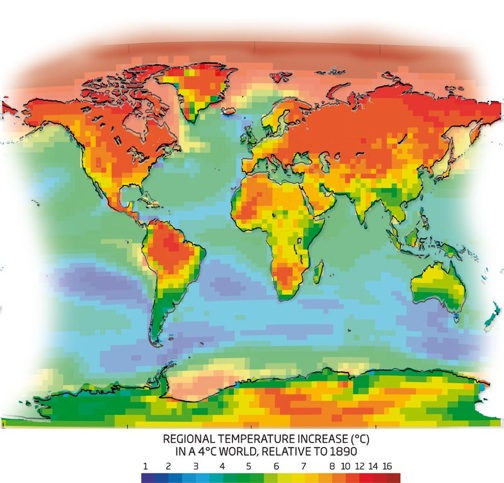 Four degrees... haven’t we seen that first figure before? In fact, a global rise of 4 degrees corresponds to a considerably larger rise of Arctic temperatures: conventionally this is between 5 and 6 degrees, but if you look at the 2009 Hadley Centre forecasts, a global rise of 4 degrees actually corresponds to an 8 degree rise across much of Greenland. Pick any number you like, but Greenland is melting. WAIS To Go? We can take some comfort in the thought that the melting of the Greenland Ice Sheet would take at least 100 years once it reached that temperature. But it accounts for just 10% of the global ice volume, the other 90% being locked away in the seemingly impermeable heart of Antarctica. Or not: the East Antarctic ice sheet (that’s the big blob that surrounds the South Pole just off-centre) seems to be quite stable, and should remain that way for the next few centuries, but West Antarctica (the peninsula that reaches north toward South America) is not stable at all. The WAIS (West Antarctic Ice Sheet) is largely below sea level, having over several million years pushed down and scoured out the bedrock beneath it, but because of its huge area, the part of it that is above water still manages to comprise around 10% of the total Antarctic ice volume. If this were to melt then the oceans would rise by another 5 metres, in addition to the thermal expansion of 1.4 metres, plus whatever has been sloughed off the Greenland ice sheet, giving us 13.6 metres, or close to 45 feet. (Is your head still above water? Please check again now.) Icebergs and glaciers have been calving from West Antarctica at an accelerating rate over the last decade, which groups such as the British Antarctic Survey (BAS) and the National Snow and Ice Data Center (NSIDC) have been carefully monitoring, with increasing alarm. In 2002, to most glaciologists’ horror, the entire Larsen B ice shelf disintegrated. It consisted largely of floating ice, and so despite the immense size of the shelf, this development had no effect on sea levels. But it did presage a new era of rapid ice movement, never before recorded in the modern era. It also had another, even more sinister side-effect on West Antarctica:
The last phrase is the most important one; at the moment there is no major concern about the status of most of the WAIS, and the temperature seems to be holding, but if the ice shelves are no longer able to hold back the progress of the glaciers, then they will accelerate towards the sea, themselves causing further instability within the WAIS. Going back to the Hadley Centre article again, it was thought that Greenland was invulnerable to change not so many years ago, but the map produced by the Centre shows warming of between 4 and 10 degrees by 2055. This would still keep the vast majority of Antarctica well below freezing; but ice under extreme pressure can exhibit unusual patterns of behaviour, including increasing internal temperature and self-lubrication. This is what often happens at the bases of deep glaciers, allowing them to slide even when temperatures are well below freezing. The results may continue to confound and horrify glaciologists for years to come while sending the rest of us scampering for higher ground. A Storm Surge of Forecasts 2001 was the first year we were able to say with any scientific certainty what was likely to happen to global sea level. It seems strange that it should take so long to provide forecasts, but until a consensus on global temperature rise had been achieved, via the IPCC’s Third Assessment Report (TAR), then the (supposedly) largest element of the sea level rise equation -- the aforementioned thermal expansion -- could not be included. So what did the IPCC say back in 2001? If you read their report, you will discover that of the absolute maximum 0.5 metre rise by 2090, predicted by this august group of scientists, a whopping 74% was due to thermal expansion, with 11cm (22%) dependent on glacier and ice cap melting (mountaintops, essentially), and a miserly 2cm attributable to the possible melting of the Greenland and Antarctic ice sheets. But then in this report the absolute worst case “business as usual” model shows a 2°C rise by 2050, which we now know to have been a bit shy of the mark. Then, in 2007, the landmark 4th Assessment Report raised the bar in both possible temperature rise (from 5.6°C to 6.4°C by 2100) and global sea level rise, to... wait for it... 0.57 metres! Of this new figure, which hardly seems to reflect the immense strides made in feedback loop analysis in the intervening six years, 38 cm or 67% of the rise is attributable to thermal expansion. With this in mind, it would pay to reflect on the types of changes described in this essay, and consider what the IPCC would have predicted had ice sheet melt been included in the final version. Forward to 2009, and two papers jump out. The first, from the relatively conservative Dr Mark Siddall at the University of Bristol is now talking about a possible rise of 0.82 metres by the end of this century, which is based on the IPCC 4AR maximum temperature of 6.4°C. The second paper, by Grinsted, Moore and Jevrejeva, again based on the IPCC maximum, suggests that a 1.3 metre rise by 2100 is not out of the question. How much of this can be attributed to Greenland and Antarctica is uncertain, but predicting the future based on thermal expansion plus a paleological record of a few thousand years, during which both ice sheets remained fully intact and temperatures never rose above 1.5°C seems a pretty poor basis upon which to predict future tipping points! If we are to take the two papers at face value and strike a mean of 1.06 metres, by overlaying the latest predictions of temperature rise – which are double the IPCC predictions – we get at least 2 metres globally. That’s just thermal expansion plus a few hundred glaciers and mountaintop ice caps. Now consider what happens when you include the following:
The last two are the inevitable effects of increasing atmospheric energy due to higher temperatures, and are critical because most coastal flooding is the result of either coastal storm surges and high winds, inland flooding inundating river catchments, or a combination of the two. The flooding of eastern England and the Netherlands in 1953, which resulted in the deaths of around 2,500 people, was a combination of a low pressure storm surge, an intense North Sea storm and a high spring tide. Without any inference of global sea level rise, the water rose along the North Sea coast by 4.5 metres.
And so there we have it. A few degrees warmer, a few metres higher, and a couple of decades later, and there we will be, floating about, holding on to other things that float, perching in tree limbs and on rooftops, and hoping to be rescued. We know where we are going to end up eventually: at least 20 metres (65 feet) higher. The one thing we still do not know is how long it will take for us to get there. We could keep waiting for the scientific community to settle on a consensus forecast, but this may take so long that it will have to be delivered through a snorkel. However, we can already observe that the doubling period of scientific climate forecasts is uncomfortably short, and, to provide for a margin of safety, we should at least double the latest estimates. If the latest forecast is for 2 metres this century, let us assume that we will see at least 4, and plan accordingly. But do the exact forecasts even matter? We already know enough to say that there is a high probability that ocean levels will rise, significantly, within the lifetimes of most of the people alive today, disrupting the patterns of daily life for much of the world's population, which tends to be clustered along the coastlines and the navigable waterways. We also know that ocean levels will continue to rise far into the future, until they are 20 to 36 metres higher than they are today. We know that continuous coastal erosion and salt water inundation, coastal flooding and displacement of coastal populations, which number in the billions, toward higher ground, will be normal and expected. We also know that there is a high chance these changes will occur based on present carbon dioxide levels, regardless of what is being currently proposed by the governments of the world to reduce greenhouse gas emissions. However, what we do not know is perhaps most important of all if you are in the middle of all this. We have not considered what ways of inhabiting the changing coastal landscape will remain viable. How will we have to adapt if any of us are to avoid being swept up in a continuous, endless surge of refugees feeling for higher ground, abandoning all they own and all they know? These are the questions that the next two parts of this series of articles will examine. * * * * * Keith Farnish is author of Time's Up! An Uncivilized Solution To A Global Crisis ( timesupbook.com) and also writes The Earth Blog and The Unsuitablog. He enjoys being a husband and dad, walking around and growing things. Dmitry Orlov is author of Reinventing Collapse from New Society Publishers. He has several articles on Culture Change, viewable at CultureChange.org Search The above article appeared on cluborlov.blogspot.com Culture Change Editor's comment on ClubOrlov:
One of the most relevant positive feedback loops regarding sea level rise is the engulfing and killing of vegetation on land by the unwelcome salt water. The affected vegetation becomes a carbon-emissions source which in turn causes more global warming and thus additional sea level rise, inundating more land and killing more plants and trees that used to be out of the harmful ocean's way. Then that vegetation becomes a source of more carbon for global warming and sea level rise. This causes even greater inundation of land areas and the vegetation on them. What happens then is more carbon emissions from the dead plant material, adding to global temperature rise. In turn... Oh, thank Goddess Gaia I finally fell off that merry-go-round. There was a play in the '60s, "Stop the World I Want to Get Off." Part Two of this series can be accessed by clicking here. |
|||
|
|
||
|
|